| Dansk English |
The Danish Coastal Authority Online Data Exhibition
Time-series data collected and produced by the Danish Coastal Authority (e.g. sea level data) are on these pages either displayed as graphs, or made available in CSV file format that can be downloaded to your own machine. Select the specific data from the options in the ‘Menu’ in the top right-hand corner.Geographic data (GIS data), such as permits, erosion, sediment transport, west coast security line, laser scans, etc., are displayed in the WebGis solution, kystatlas.kyst.dk , or on the Danish Nature Agency's GIS portal, gis.nst.dk. The data can be downloaded from the two websites and displayed in your own GIS programs using REST/WMS/WFS services.
Data examples
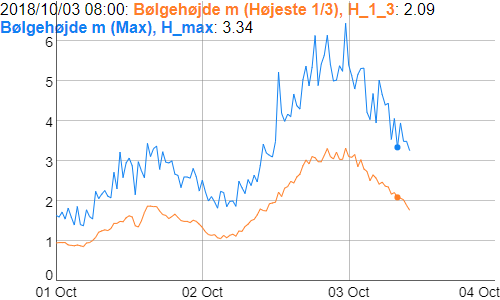
The graph presents wave data. For more information, select ‘Wave Measurements’ from the list of options in the ‘Menu’ above. |
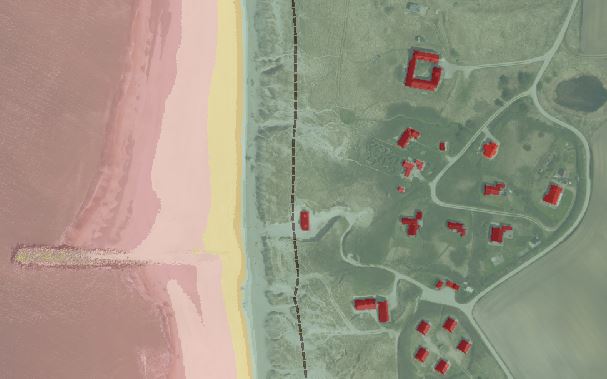
The map shows an excerpt of the coastline with a security line mark-up (dotted line). Click on the image to view the most recent security line under the West Coast Joint Agreement layer ('Fćllesaftale vestkyst'). |